InstallingInstalled Tara
Tara is ready · 15 Tahoe-100M tools
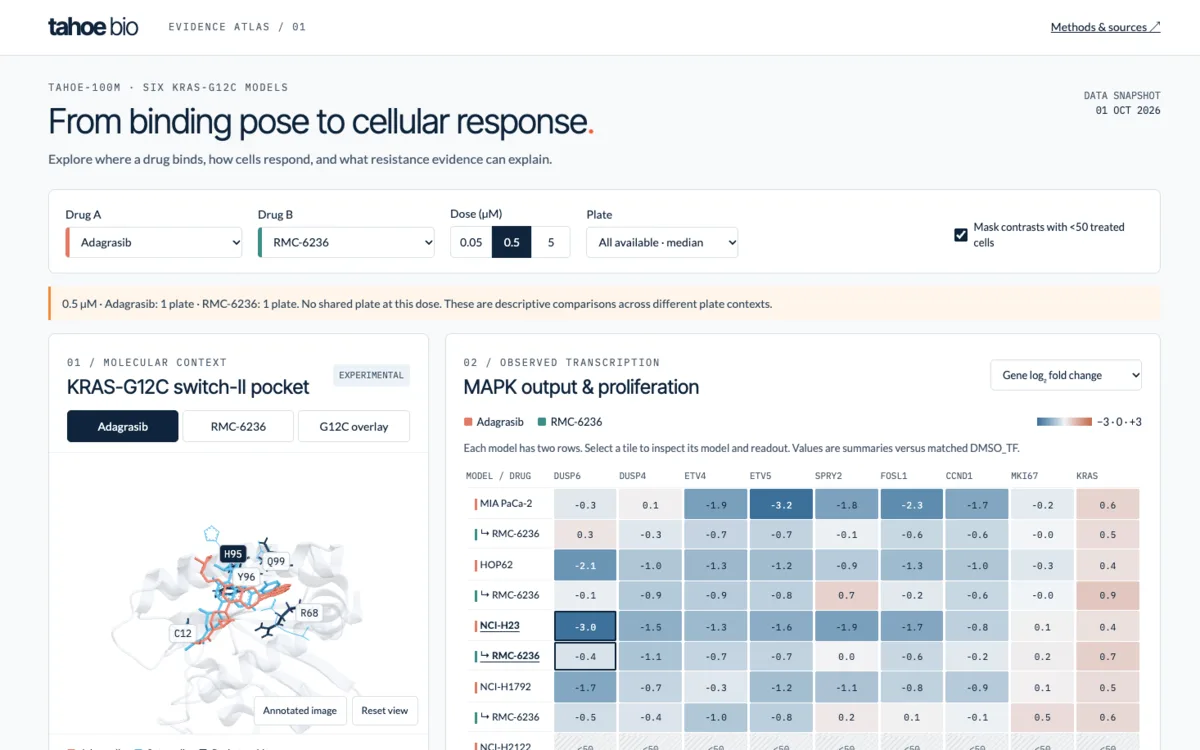
Tara Boltz Molecular Structure Viewer Compare adagrasib and sotorasib responses in KRAS-G12C models in Tahoe-100M. Show their binding poses in KRAS structures, then explain whether mutations in the binding pocket can confer resistance to one drug but not the other.
Working 0sWorked for 18m 13s
- tara get_drug_info adagrasib, sotorasib
- tara list_cell_lines KRAS-G12C models
- tara get_differential_expression MAPK targets
- tara get_pathway_scores KRAS signaling
- boltz predict KRAS-G12C switch-II pocket
- sites serve 127.0.0.1:8794
Opened Molecular Structure Viewer in chat
What other drugs can we use for this comparison other than sotorasib
Worked for 2m 41s
RMC-6236 is the most useful alternative for a Tahoe-100M comparison with adagrasib. I verified response rows for these candidates across all six annotated KRAS-G12C models at 0.05, 0.5 and 5 µM:
ComparatorTarget/mechanismWhat the comparison tests
RMC-6236Active-state, multi-selective RAS inhibitorDifferent ways of directly inhibiting RAS
TrametinibMEK1/2Direct KRAS inhibition versus downstream pathway blockade
BI-3406SOS1KRAS inhibition versus preventing its activation
MK-8353 or temuterkibERK1/2Whether downstream ERK inhibition produces similar responses
Tara In Tahoe-100M, which compounds have pathway-level transcriptional responses most similar to saquinavir? Show the strongest matches and the pathways behind the similarity.
Working 0sWorked for 12m 29s
- tara get_drug_info saquinavir
- tara search_gene_sets Hallmark, 50 pathways
- tara get_pathway_scores 0.05, 0.5 and 5 µM
- tara run_sql cosine similarity, 352 compounds
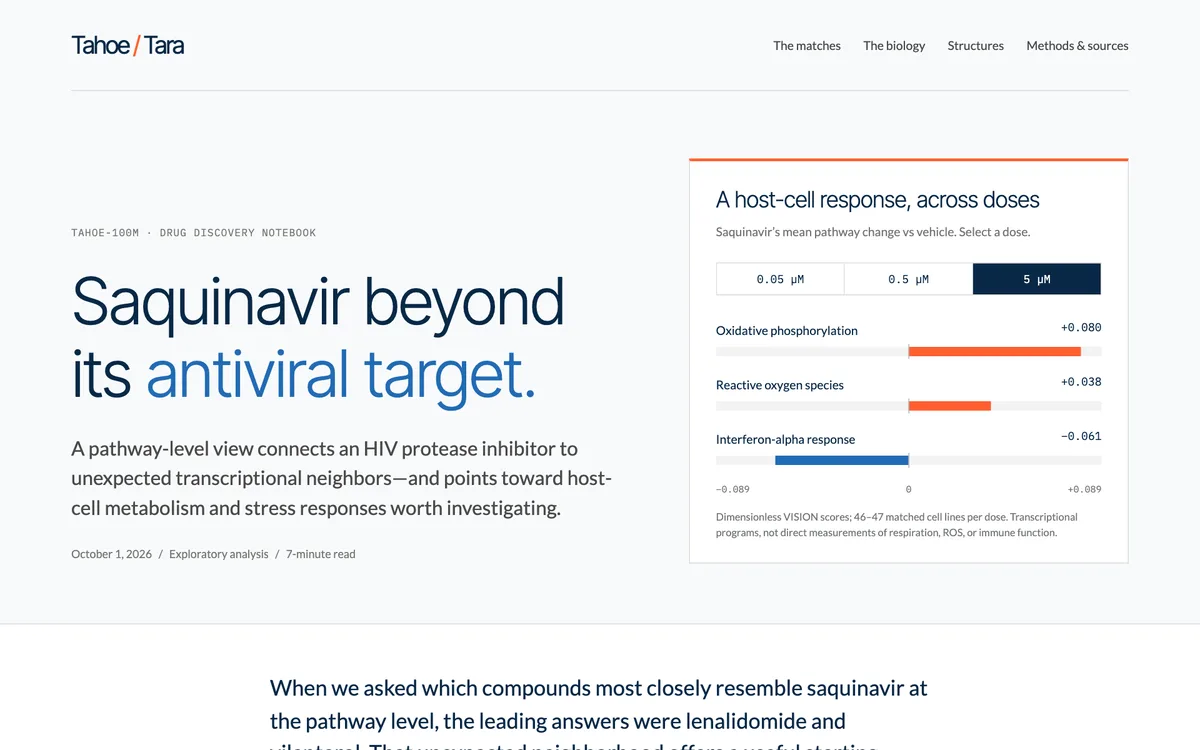
Lenalidomide (hemihydrate) and vilanterol are saquinavir’s strongest matches in the Hallmark pathway analysis, and both remain first and second after removing patterns shared across treatments within each plate.
RankCompoundCosine similarityMain shared pathway responses
1Lenalidomide (hemihydrate)0.590Oxidative phosphorylation ↑; TNFα/NF-κB ↑; reactive oxygen species ↑
2Vilanterol0.582Oxidative phosphorylation ↑; TNFα/NF-κB ↑; epithelial–mesenchymal transition ↓
3Gemfibrozil0.552Interferon-α response ↓; TNFα/NF-κB ↑; p53 pathway ↑
4Resveratrol0.533Interferon-α response ↓; TNFα/NF-κB ↑; E2F targets ↓
Write up these findings as a blog post for drug-discovery scientists, outlining the high-level narrative of this analysis and what it reveals about saquinavir’s unexpected biological effects. Open it as a local webpage
Working 0sWorked for 7m 33s
- tara get_pathway_scores oxidative phosphorylation, ROS
- tara get_drug_info lenalidomide, vilanterol, ritonavir
- sites write saquinavir.html
Written and opened Saquinavir beyond its antiviral target as a local webpage.
It includes the scientific narrative, interactive dose comparison, pathway figure, cited literature, and proposed validation experiments—with observed findings clearly separated from mechanistic hypotheses.
Does binimetinib up- or down-regulate the KRAS signaling signature in Tahoe-100M (median across cell lines)? Write it up in findings.md.
WorkingRan 3 MCP tools
- tara get_drug_info binimetinib
- tara search_gene_sets Hallmark KRAS signaling
- tara get_pathway_scores binimetinib, 50 cell lines
Down-regulates. The median Hallmark KRAS signaling score is negative at every dose (about −0.02 at 0.05 µM to −0.045 at 5 µM), and negative in 46 of the 50 cell lines.
Edited findings.md +10
+⊙ Full access
∞ AgentAuto
GPT-6.1 Sol HighOpus 5.5@
↑
KRAS G12C · Pose & response127.0.0.1:8794
tahoebioEvidence atlas / 01Methods & sources ↗
Tahoe-100M · Six KRAS-G12C models
From binding pose to cellular response.
Explore where a drug binds, how cells respond, and what resistance evidence can explain.
Drug AAdagrasib
Drug BRMC-6236
Dose (µM)0.050.55
PlateAll available · median
01 / Molecular context
KRAS-G12C switch-II pocket
AdagrasibRMC-6236G12C overlay
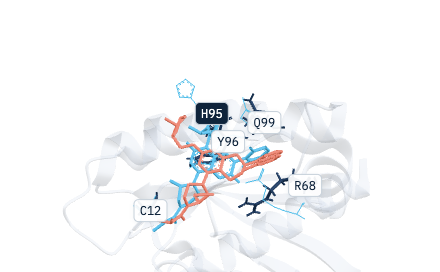
AdagrasibSotorasibPocket residues
02 / Observed transcription
MAPK output & proliferation
AdagrasibRMC-6236
Model / drugDUSP6DUSP4ETV4ETV5SPRY2FOSL1CCND1MKI67KRAS
MIA PaCa-2−0.30.1−1.9−3.2−1.8−2.3−1.7−0.20.6
↳ RMC-62360.3−0.3−0.7−0.7−0.1−0.6−0.6−0.00.5
HOP62−2.1−1.0−1.3−1.2−0.9−1.3−1.0−0.30.4
↳ RMC-6236−0.1−0.9−0.9−0.80.7−0.2−0.6−0.00.9
NCI-H23−3.0−1.5−1.3−1.6−1.9−1.7−0.80.10.4
↳ RMC-6236−0.4−1.1−0.7−0.70.0−0.6−0.20.20.7
NCI-H1792−1.7−0.7−0.3−1.2−1.1−0.8−0.90.10.5
↳ RMC-6236−0.5−0.4−1.0−0.80.20.1−0.10.50.6
NCI-H2122<50<50<50<50<50<50<50<50<50
↳ RMC-6236<50<50<50<50<50<50<50<50<50
NCI-H2030−2.5−0.8−1.0−1.2−0.1−0.9−0.7−0.10.5
↳ RMC-6236−0.4−0.5−0.9−0.8−0.1−0.4−0.40.10.4
- # Binimetinib and KRAS signaling in Tahoe-100M
- **Down-regulates.** The median Hallmark KRAS signaling score is negative at every dose, and negative in 46 of the 50 cell lines.
- | Dose | Median score |
- | --- | --- |
- | 0.05 µM | about −0.02 |
- | 5 µM | about −0.045 |
- Source: Tahoe-100M via Tara (get_pathway_scores), median across cell lines.